
- Gold price rebounds from three-week lows as the focus shifts to US inflation data.
- The US Dollar struggles with US Treasury bond yields amid mixed Fedspeak and a better mood.
- Gold price eyes a meaningful recovery above the 21-day SMA at $2,043 amid a Bull Cross.
Gold price is back in the green early Tuesday, building on the turnaround from three-week lows of $2,017 set on Monday. The US Dollar (USD) is holding its pullback amid a better market mood and a modest uptick in the US Treasury bond yields.
Gold price benefits from softer US inflation expectations
Risk sentiment remains in a firmer spot, as Asian equities track the Wall Street tech rally, endorsed by renewed hopes of aggressive interest rate cuts by the US Federal Reserve (Fed) later this year.
The dovish Fed expectations were reinforced after the New York Fed’s latest Survey of Consumer Expectations showed Tuesday that US consumers’ projection of inflation over the short run fell to the lowest level in nearly three years in December.
The US Dollar snapped its winning run and pulled back sharply from three-week highs against its major rival currencies, tracking the sell-off in the US Treasury bond yields on softer US inflation expectations-induced bets for a slew of Fed rate cuts this year.
Markets are currently pricing in about 61% odds of a March Fed rate cut, up from a 55% chance seen following the release of the upbeat US Nonfarm Payrolls (NFP) report. Friday’s NFP data showed that the US economy added 216K jobs in December, beating the market forecast of a 170K increase.
The US Dollar rallied to fresh multi-week highs on strong US labor market report and less dovish Fed commentaries, weighing negatively on the Gold price. Fed Governor Michelle Bowman said on Monday that “inflation could fall further with policy rate held steady for some time.” Atlanta Federal Reserve (Fed) President Raphael Bostic said that he expects two 25 basis points (bps) rate cuts by year-end 2024.
All eyes now turn to Thursday’s US Consumer Price Index (CPI) data, which will help revertebrate the market’s pricing for the Fed rate cuts, impacting the US Dollar and Gold price valuations. The US CPI is forecast to rise at an annual pace of 3.2% in December, up slightly from a 3.1% increase in November. The Core CPI inflation is set to decline to 3.8% YoY in the reported period versus 4.0% in November.
In the meantime, the broader market sentiment and the Fed expectations will continue to influence the price direction of the US Dollar-denominated Gold.
Gold price technical analysis: Daily chart
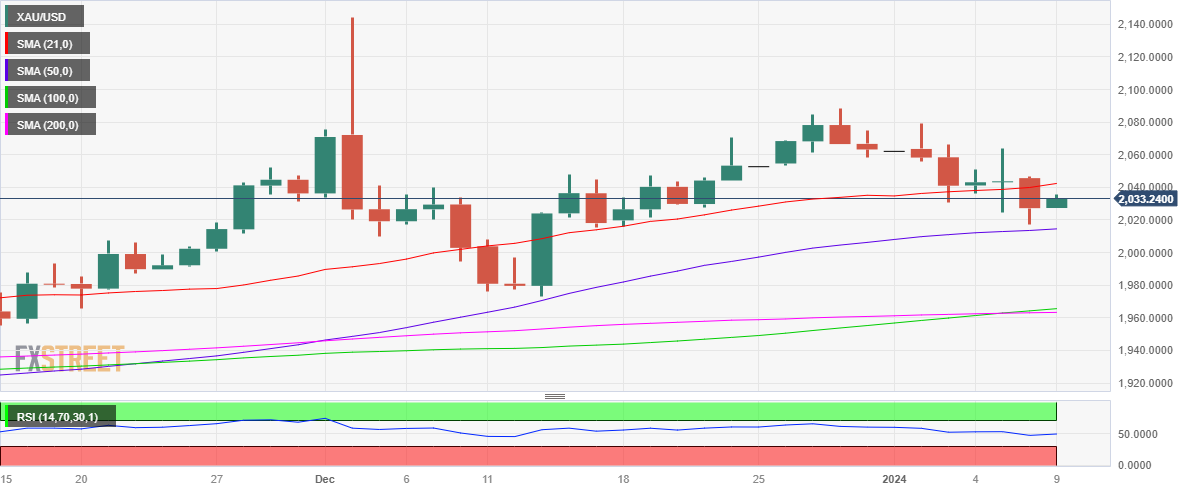
The near-term technical outlook for Gold price remains slightly in favor of buyers but acceptance above the 21-day Simple Moving Average (SMA) at $2,042 holds the key.
The next upside target for Gold price is envisioned at Friday’s high of $2,054, above which doors reopen for a test of the $2,100 barrier.
The 100-day Simple Moving Average (SMA) closed above the 200-day SMA on Friday, validating an impending Bull Cross.
The 14-day Relative Strength Index (RSI) indicator is looking to recapture the midline, suggesting that a meaningful Gold price recovery could be in the offing.
On the downside, the initial support is seen at the $2,015 confluence, where the 50-day SMA and the previous day’s low converge.
A daily closing below the latter is critical to resuming the downtrend toward the $2,000 mark.
 previous

