
- Gold price consolidates around $2,030, as traders await US inflation data for fresh direction.
- The US Dollar pauses Tuesday’s turnaround amid sluggish US Treasury bond yields and risk-aversion.
- Gold price ranges between 21-day SMA and 50-day SMA as bearish RSI counters Bull Cross.
Gold price is replicating the recovery move seen in Tuesday’s Asian trading early Wednesday, as broad risk-aversion underpins the traditional safe-haven.
Geopolitical risks keep Gold price afloat
Simmering geopolitical tensions in the Middle East and increased cautiousness ahead of Thursday’s US inflation report keep investors away from riskier assets, scurrying for safety in the Gold price, as the US Dollar struggles to capitalize on the downbeat mood. The US Treasury bond yields also stay directionless, with the benchmark 10-year bond yields at around the 4.0% level.
Iran-backed Houthi militants launched the largest attack to date on commercial merchant vessels, CNBC News reported on Tuesday, citing a senior US Defense Department official.
Further, investors call for prudence, as markets keenly await the critical US Consumer Price Index (CPI) data on Thursday to gauge the pace and timings of the US Federal Reserve (Fed) interest rate cuts later this year. The current market positioning suggests a 62% chance of a rate cut by the Fed in March, according to the CME Group’s FedWatch tool.
The US CPI is expected to rise at an annual pace of 3.2% in December, up slightly from a 3.1% increase in November. The Core CPI inflation is set to decline to 3.8% YoY in the reported period versus 4.0% in November.
The US Dollar (USD) came under renewed selling pressure at the start of the week on Monday after the New York Fed’s latest Survey of Consumer Expectations showed Tuesday that US consumers’ projection of inflation over the short run fell to the lowest level in nearly three years in December.
However, the US Dollar regained upside traction on Tuesday, as uncertainty before the US government shutdown and the fourth-quarter earnings reports fuelled a flight to safety in American trading.
Looking ahead, Gold price is likely to extend its range trade, in the absence of top-tier US economic data and pre-CPI data nervousness. But Gold traders could find fresh impetus from the sentiment on Wall Street and Fedspeak.
In case risk-aversion intensifies, the Gold price rebound could be checked by the resurgent safe-haven demand for the US Dollar. Conversely, dovish Fed expectations could keep the downside cushioned in Gold price.
Gold price technical analysis: Daily chart
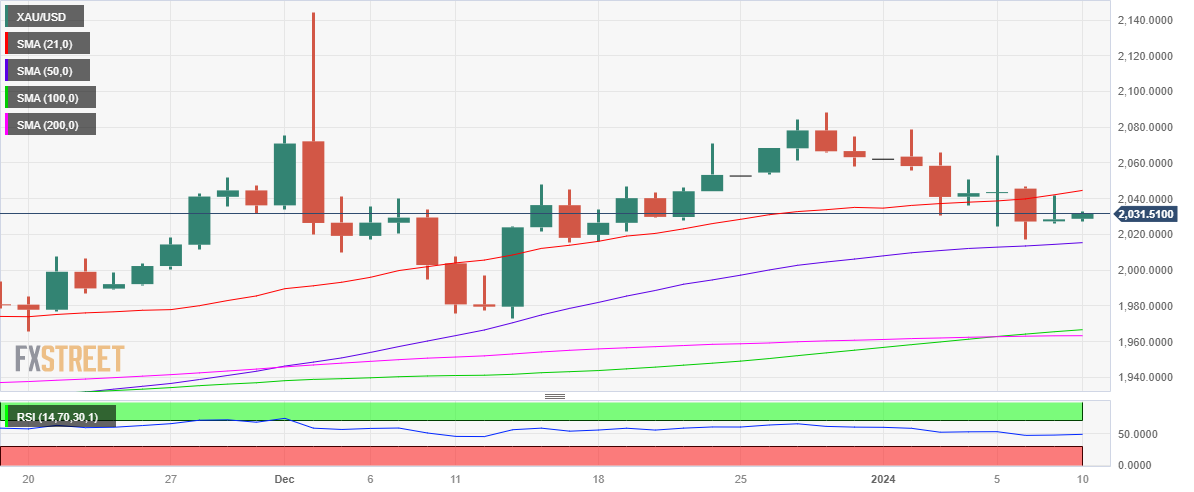
Gold price is likely to maintain its side-ways momentum so long as it remains confined between the 21-day Simple Moving Average (SMA) and 50-day SMA at $2,045 and $2,015 respectively.
The 14-day Relative Strength Index (RSI) indicator sitting just beneath the midline, restricting Gold buyers while they continue to find support from the Bull Cross confirmed last Friday..
The 100-day SMA closed above the 200-day SMA on Friday, confirming the bullish crossover.
If the rebound sustains, the immediate resistance is seen at the 21-day SMA at $2,045. The next bullish target for Gold price is envisioned at Friday’s high of $2,054, above which doors reopen for a test of the $2,100 barrier.
On the downside, the initial support is seen at the $2,015 confluence, where the 50-day SMA and Monday’s low coincide. A daily closing below the latter is critical to resuming the downtrend toward the $2,000 mark.
 previous

