
- Gold price recovery falters once again near $2,060 ahead of Fed Waller’s speech.
- Middle East geopolitical escalation, higher US Treasury bond yields bump up the US Dollar.
- Gold price confirmed a symmetrical triangle breakout on Monday, upside potential stays intact.
Gold price is challenging the $2,050 barrier early Tuesday, feeling the heat from resurgent US Dollar (USD) demand amid a further escalation in the Middle East geopolitical tensions.
Gold price looks to geopolitics and Fed Waller’s speech
Gold price has turned red for the first time in four trading days, stalling its recovery momentum from three-week lows of $2,013. Gold price is undermined by renewed US Dollar demand across the board, as investors scurry for safety in the Greenback amid intensifying geopolitical tensions in the Middle East.
Risk sentiment took a hit following reports that Iran’s Islamic Revolutionary Guard Corps (IRGC) fired missiles at targets near the US Consulate in Erbil, Iraq. Iranians retaliated against the terrorist attacks this month that killed almost 100 people near the burial site of General Qassem Soleimani.
Meanwhile, Gold price also bears the brunt of rising US Treasury bond yields, as they play catch up after the holiday weekend. The uptick in the US Treasury bond yields also acts as a tailwind to the US Dollar advance.
The Greenback also takes advantage of the market’s concerns surrounding China’s economic outlook, with the Gross Domestic Product (GDP) and activity data coming up on Wednesday.
Attention now turns toward the highly-anticipated speech by the US Federal Reserve (Fed) Governor Christopher Waller due later at 16:00 GMT. Waller is set to speak about the economic outlook and monetary policy at the Brookings Institution, in Washington DC. Audience questions are expected to follow.
During his last appearance, Waller flagged a dovish policy pivot, smashing the US Dollar alongside the US Treasury bond yields. Waller noted that “if inflation consistently declines, there is no reason to insist that interest rates need to remain really high.
Therefore, his comments will hold the key to the market’s pricing of the March Fed rate cut. Currently, markets are wagering roughly 70% odds that the Fed will lower rates in March.
Gold price technical analysis: Daily chart
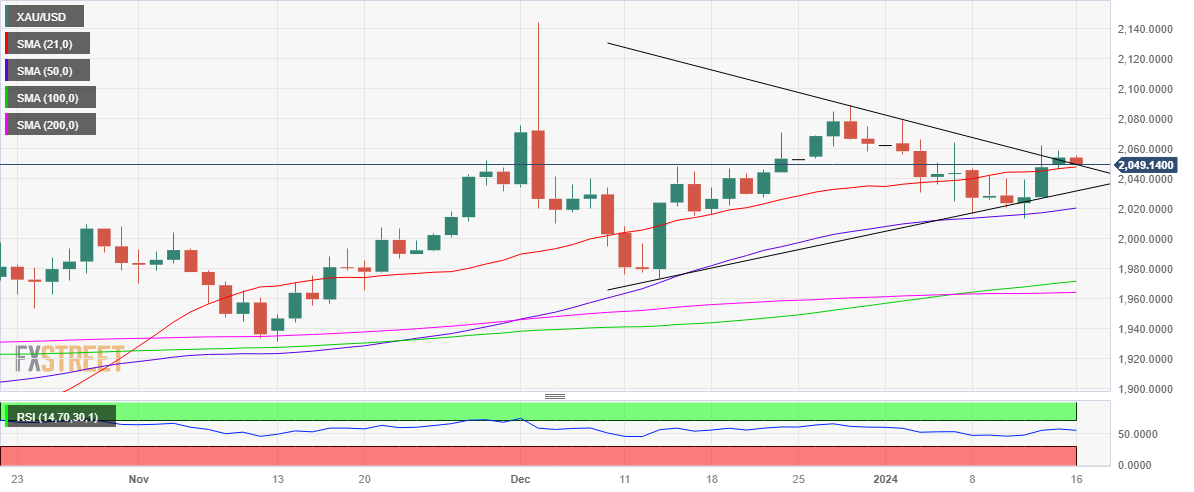
Despite the pullback from near multi-day highs, the short-term technical outlook for Gold price remains constructive, in the wake of a symmetrical triangle breakout confirmed on the daily chart on Monday.
Gold price closed Monday above the falling trendline resistance at $2,052, charting a bullish technical breakout.
The 14-day Relative Strength Index (RSI) indicator is turning south but holds above the midline, suggesting that any pullbacks in Gold price will be a good buying opportunity.
Gold buyers could find fresh demand at the 21-day SMA resistance-turned-support of $2,047. A daily candlestick close below the latter is critical to reviving the bearish interests.
The next downside target is seen at triangle support of $2,049. Further down, Friday’s low of $2,027 could offer some temporary respite to Gold buyers.
The last line of defense for Gold optimists is seen at the 50-day SMA at $2,020.
On the upside, powerful resistance is seen at around $2,060, above which the static resistance at $2,080 will come into play. If the upbeat momentum regains traction, a retest of the $2,100 barrier cannot be ruled out.
 previous

