
- Gold price is testing critical daily support ahead of Thursday’s US Retail Sales data.
- Middle East geopolitical escalation and easing Fed cut bets support the US Dollar.
- Gold price witnessed a symmetrical triangle fakeout, as tables turned against buyers.
Gold price is licking its wounds at around $2,025 in Wednesday’s Asian trading, having incurred heavy losses on Tuesday, courtesy of the unabated demand for the US Dollar (USD) amid a further escalation in the Middle East geopolitical tensions and easing bets for aggressive US Federal Reserve (Fed) rate cuts this year.
Gold price eyes US Retail Sales for repricing of Fed expectations
The US Dollar found solid demand on Tuesday, surging to its highest level in more than five weeks against its major rivals near 103.40 after risk sentiment took a big hit on reports that Iran’s Islamic Revolutionary Guard Corps (IRGC) fired missiles at targets near the US Consulate in Erbil, Iraq. Also, Iran-backed Houthi rebels struck a US-owned cargo vessel with an anti-ship ballistic missile off the coast of Yemen.
Additionally, investors pared back bets for aggressive Fed rate cuts this year, following Fed Governor Christopher Waller’s less dovish speech, offering extra legs to the US Dollar comeback. Waller walked back on his previous view on the dovish policy pivot, as he noted on Tuesday that while inflation was approaching the central bank’s 2.0% target, the Fed should not rush to cut interest rates until lower inflation can clearly be sustained.
In Wednesday’s trading so far, risk-aversion continues to dominate the market sentiment, keeping the US Dollar underpinned near multi-week highs. Therefore, Gold price remains vulnerable as persistent geopolitical tensions in the Red Sea are likely to keep investors on edge, supporting the US Dollar’s safe-haven status.
In the latest developments, the US military carried out new strikes in Yemen late Tuesday against anti-ship ballistic missiles in a Houthi-controlled part of the country after a missile struck a Greek-owned vessel in the Red Sea.
Looking ahead, the US Retail Sales data due later at 13:30 GMT will be closely eyed for fresh hints on the timing and pace of the Fed rate cuts. Markets are now pricing in a 65% probability of a rate cut by the Fed in March, according to the CME Group’s FedWatch tool, compared with the 81% likelihood at the start of the week.
The US Retail Sales are seen rising 0.4% MoM in December, compared with a 0.3% increase reported in November. Retail Volume, ex-Autos, is set to rise 0.2% in the same period. A weak US Retail Sales report is likely to point to easing inflationary pressures, in turn, reverberating aggressive Fed rate cut expectations.
Gold price technical analysis: Daily chart
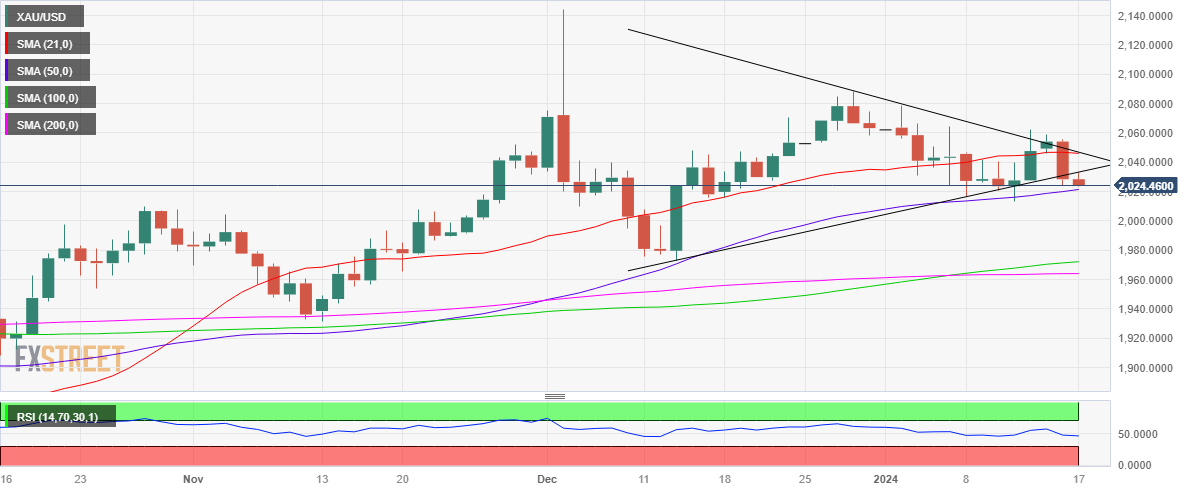
As observed on the daily chart, Gold price portrayed a symmetrical triangle fakeout on Tuesday and in fact confirmed a downside break from the triangle after closing the day below the rising trendline support, then at $2,031.
Gold sellers barged in after the 21-day Simple Moving Average (SMA) at $2,046 failed to hold the fort.
Gold price is challenging the critical 50-day SMA support at $2,021, at the time of writing. Failure to defend the latter on a sustained basis could fuel a fresh sell-off toward the $2,000 mark.
Ahead of that, the $2,010 round level could offer some temporary support to Gold buyers.
The 14-day Relative Strength Index (RSI) indicator has flipped bearish, as it falls further below the midline.
Any recovery in Gold price would need acceptance above the triangle support now turned resistance at $2,033. The next strong upside barrier is seen at $2,046, the confluence of the 21-day SMA and the triangle resistance.
Fresh buying opportunities will generate above the latter, allowing Gold price to retest the $2,050 psychological level.
 previous

