
- Gold price looks to revisit two-week highs above $2,050 early Thursday.
- US Dollar and Treasury bond yields look to US jobs data after the hawkish Fed.
- Gold price confirmed a triangle breakout amid a bullish daily RSI.
Gold price is back in the green, on its way to retest the two-week high of $2,056 set on Wednesday. The US Dollar (USD) is fading its uptick amid a renewed appetite for risk assets, as markets cheer China’s fiscal support while assessing the US Federal Reserve (Fed) interest rate outlook.
Gold price regains poise, as focus shifts to US jobs data
China’s Vice Finance Minister Wang Dongwei announced on Thursday that they “will appropriately increase investment under the central government budget”, which “will help expand domestic demand.”
This comes after China’s Caixin Manufacturing Purchasing Managers Index (PMI) remained at 50.8 in January, suggesting a steady growth in the country’s manufacturing sector. The market consensus was for a 50.6 reading.
The further boost to risk sentiment in Asia faded the uptick in the US Dollar, motivating Gold buyers to regain control. Additionally, the persistent weakness in the US Treasury bond yields across the curve is also helping the non-yielding Gold price to recover lost ground.
US Treasury bond yields came under the bus on Wednesday and smashed the US Dollar alongside after the ADP Employment Change data came in below estimates at 107K and following the Treasury Department’s quarterly announcement that it would sell $121 billion in notes and bonds next week, up from $112 billion last quarter.
However, a relatively hawkish tone delivered by the Fed, following the conclusion of its two-day policy meeting, failed to offer any respite to the US Treasury bond yields while the US Dollar jumped on the Fed’s pushback against a March rate cut. The US central bank extended the pause, as Fed Chair Jerome Powell said “based on the meeting today, I don’t think likely we will have a rate cut in March.”
Markets are currently pricing in a 35% probability that the Fed will cut rates in March while for May the odds stand at 92%.
All eyes now turn toward Friday’s US Nonfarm Payrolls data to affirm the pushback to May for the Fed to lower the interest rates. Ahead of that, traders will look to the US Jobless Claims, Unit Labor Cost (Q4) and the ISM Manufacturing PMI data for fresh trading impetus in Gold price. The upcoming data could help reprice the market’s expectations for the dovish Fed pivot.
Gold price technical analysis: Daily chart
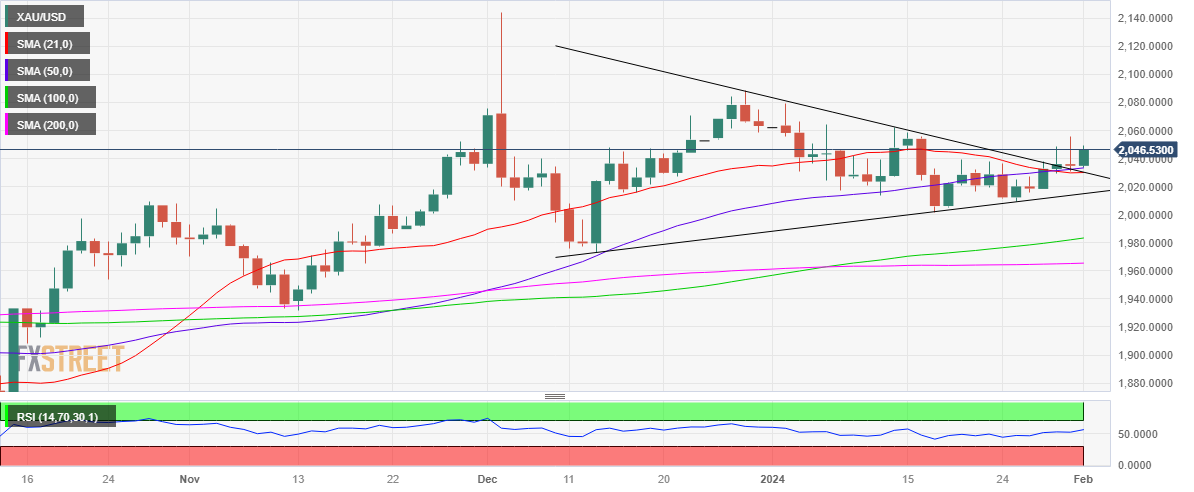
As observed on the daily chart, Gold price confirmed an upside break from a month-long symmetrical triangle formation after closing convincingly above the falling trendline resistance at $2,036 on Wednesday.
The 14-day Relative Strength Index (RSI) indicator points north above the midline, suggesting that there is enough room for the upside.
Traders have paid little attention to the Bear Cross validated on Tuesday after the 21-day Simple Moving Average (SMA) crossed the 50-day SMA from above on a daily closing.
With the bullish bias likely intact in Gold price, the immediate strong resistance is seen at the previous day’s high of $2,056, above which the December 12 high of 2,062 wil be tested. Further up, the $2,070 round figure could challenge bearish commitments.
On the downside, powerful support continues to remain at the $2,030 region, where the 21- and 50-day Simple Moving Averages (SMA) hang around.
Acceptance below the latter could reinforce the selling interest for a test of the triangle support at $2,016. If the downside momentum gains traction, a test of the key $2,000 threshold could be in the offing.
 previous

