
- Gold price trades on the wrong footing at the start of the new week.
- Markets stay cautious amid holiday-thinned trade, ahead of Tuesday’s US CPI data.
- Gold price test critical daily support line at $2,023, as RSI flips bearish.
Gold price is looking to extend the previous week’s downtrend at the start of the new week on Monday. Gold price is testing the $2,020 level even though the US Dollar (USD) and the US Treasury bond yields remain on the back foot amid holiday-thinned trading conditions. Most of the major Asian markets are closed on Monday, in observance of the Lunar New Year holiday.
Gold price stays vulnerable, with eyes on US CPI data
Markets are also sensing a calm before Tuesday’s US Consumer Price Index (CPI) data storm, as they refrain from placing any fresh directional bets on the US Dollar, as well as, the Gold price. Investors are resorting to adjusting their positions on the US Dollar, keeping the Greenback on the back foot so far this Monday.
Last week, the US Dollar managed to find its feet against its major rivals, despite markets paring back aggressive US Federal Reserve (Fed) interest rate cut bets, as a batch of strong US data affirmed the economic resilience.
Markets are now pricing only a 16% chance of a March Fed rate cut. Meanwhile, the odds of a rate cut by the Fed for the May meeting stand at about 60%.
Additionally, renewed concerns over China’s economic slowdown also helped revive the safe-haven demand for the US Dollar. However, further gains in the Greenback remained capped due to the risk-rally on global stocks on encouraging corporate results.
Looking ahead, Gold price is likely to maintain its bearish momentum amid pre-US CPI data-led caution trading and easing Israel-Hamas geopolitical tensions. The Israeli military said on Monday it had conducted a “series of strikes” on southern Gaza that has now “concluded,” days after Israeli Prime Minister Benjamin Netanyahu rejected a ceasefire proposal from Hamas.
Speeches from Fed policymakers, however, will grab some attention ahead of the critical US inflation report for January, as it could pave the way for a dovish Fed pivot.
On Friday, the Labor Department’s Bureau of Labor Statistics (BLS) unveiled the annual revisions to the CPI data. The CPI rose 0.2% in December instead of 0.3% as reported last month. But data for November was revised up to show the CPI increasing 0.2% rather than 0.1% as previously estimated. The CPI gained 0.1% in October vs. 0% reported previously.
Upward revisions to the US CPI figures briefly propelled US Treasury bond yields but surging Wall Street indices dulled the attractiveness of the yields and the safe-haven Gold price.
Gold price technical analysis: Daily chart
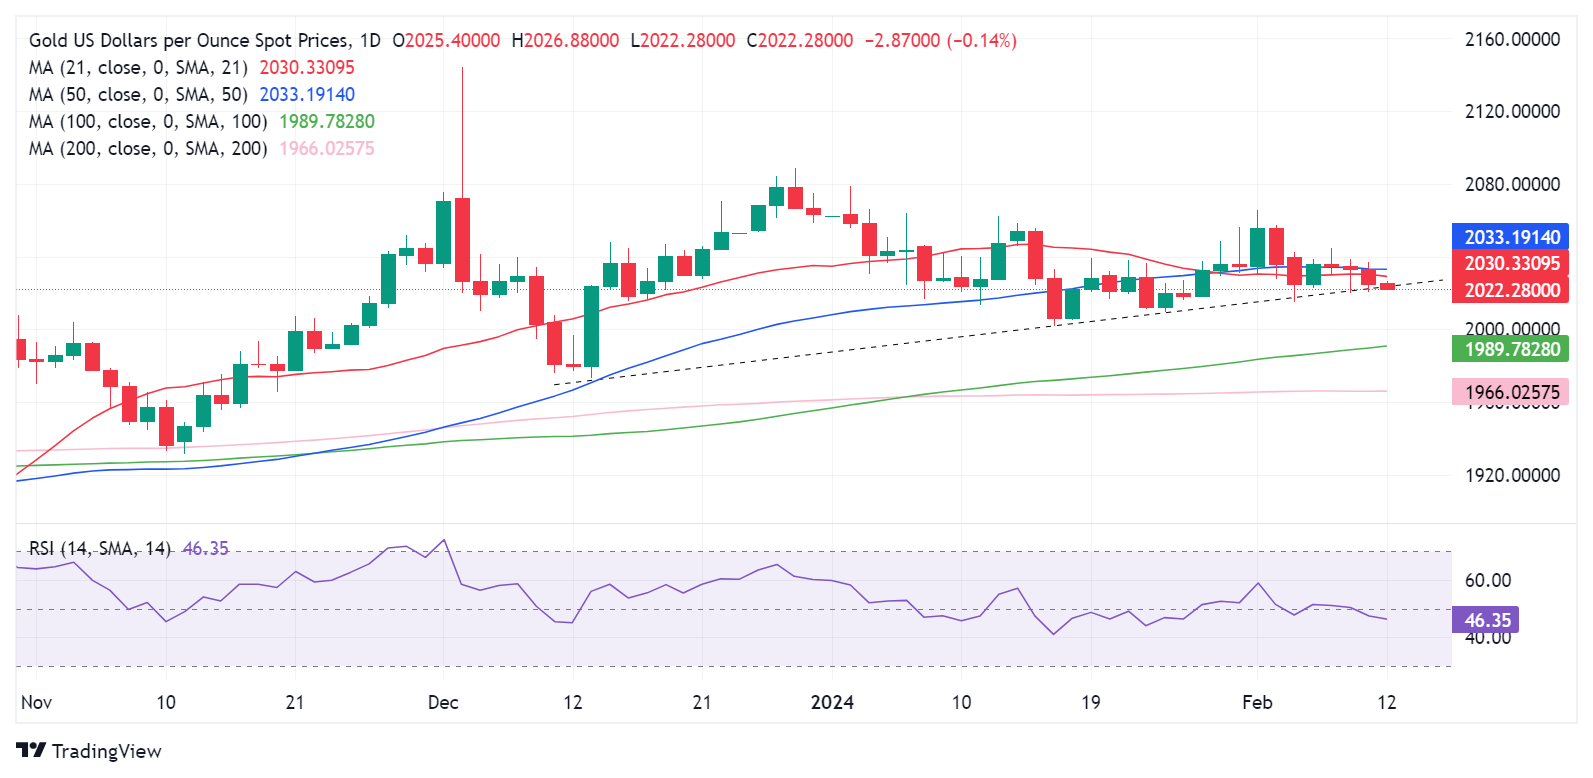
As observed on the daily chart, Gold price is teasing a downside break of the rising trendline support at $2,023.
A daily candlestick close below that level will trigger a fresh downside toward the $2,000 mark. Ahead of that, the $2,010 round figure will test bullish commitments.
The last line of defense for Gold buyers is envisioned at the ascending 100-day Simple Moving Average (SMA) at $1,990.
The 14-day Relative Strength Index (RSI) is pointing south below the 50 level, suggesting that there is more room for Gold sellers to flex their muscles.
Meanwhile, the 21-day and 50-day SMAs Bear Cross also remains in play.
On the flip side, if the trendline support at $2,023 holds, Gold buyers will challenge the $2,030-$2,035 supply zone on an initial rebound. That zone is the confluence of the 21-day and 50-day SMAs.
Further up, the $2,040 level will offer stiff resistance. Acceptance above the latter is needed to take on the $2,050 psychological level.
 previous

