
- Gold price licks wounds as US inflation data pares Fed easing expectations.
- US Dollar pauses before the next push higher; focus shifts to Fedspeak.
- Gold price appears ‘sell the bounce’ trade amid bearish technicals.
Gold price is flirting with the lowest level in two months near $1,990 early Wednesday, consolidating the previous day’s steep sell-off. The US Dollar (USD) rally has taken a breather alongside the US Treasury bond yields, allowing Gold price a temporary relief.
Hot US CPI data reinforces Gold sellers
Having briefly extended Tuesday’s slide in Asian trading on Wednesday, Gold price is nursing losses, as markets resort to profit-taking on the US Dollar upsurge that followed the hotter-than-expected US Consumer Price Index (CPI) inflation data.
The annual CPI inflation in the US fell to 3.1% in January following a brief increase to 3.4% in December but outpaced forecasts of 2.9%. The US CPI edged up 0.3% MoM, the most in four months, and above forecasts of 0.2%. Further, annual core CPI rose 3.9%, compared to expectations of a 3.7% growth. The monthly inflation rate edged up to 0.4%.
Hot US inflation report reinforced the US Federal Reserve’s (Fed) pushback against early and aggressive interest rate cut expectations, triggering a fresh rally in the US Treasury bond yields and the US Dollar. The benchmark 10-year US Treasury bond yields hit fresh three-month highs of 4.33%, where it now wavers. The US Dollar Index tested 105.00, a new three-month top.
Asian traders hit their desks early Wednesday and reacted to the US CPI data, keeping Gold price under pressure. Markets now price out a March Fed rate cut while chances of a May easing are seen around 65%.
Looking ahead, the US Dollar could resume its uptrend if risk aversion intensifies and the Fed policymakers back the hawkish interest rate outlook. Global markets are in a downward spiral following the hot US CPI data. In such a scenario, Gold price is likely to continue its bearish momentum. A potential rebound in Gold price, however, cannot be ruled out should investors take profits off the table.
Gold price technical analysis: Daily chart
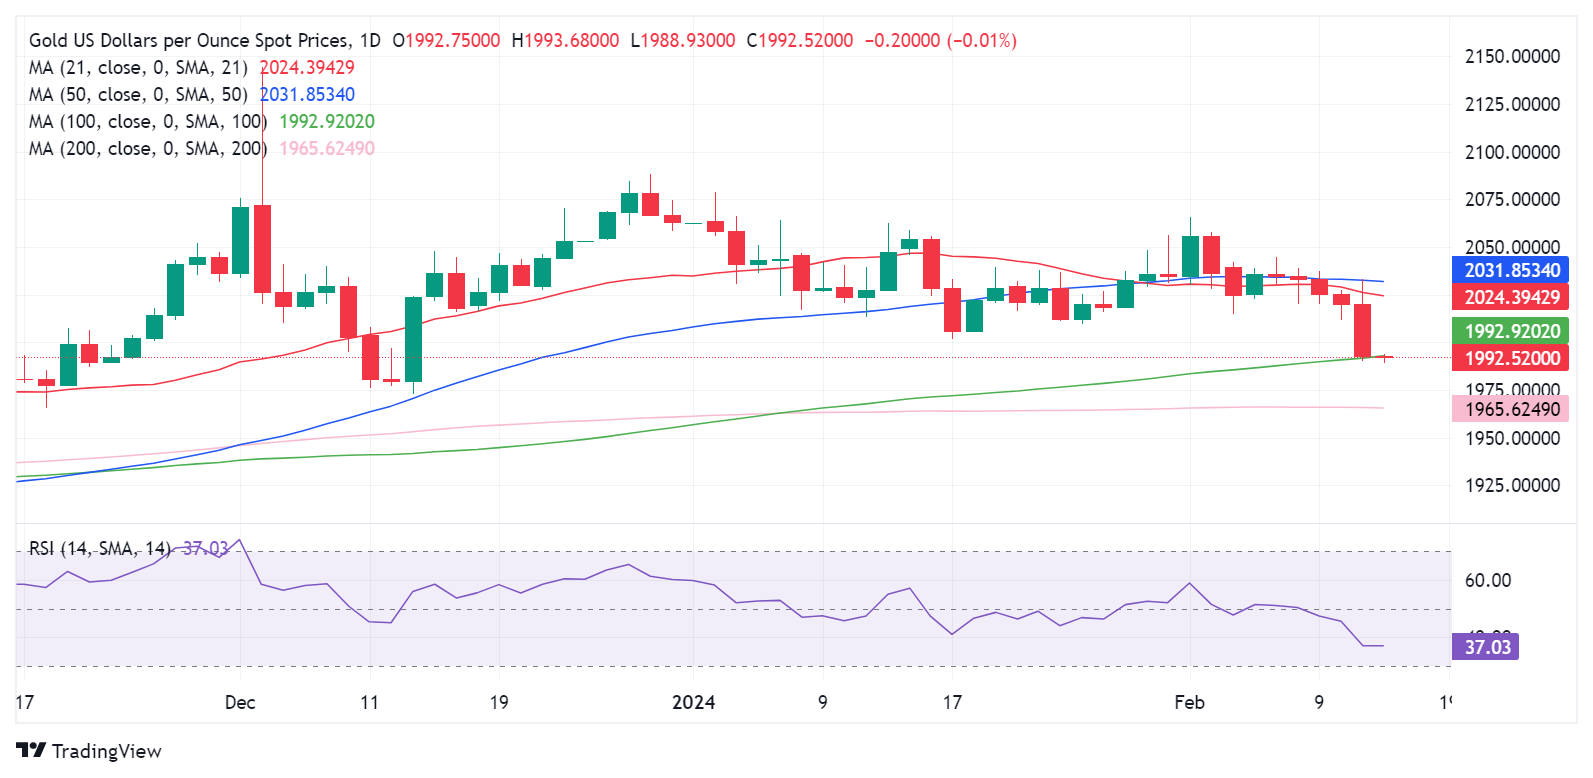
As observed on the daily chart, Gold price managed to close Tuesday above the 100-day Simple Moving Average (SMA) at $1,993.
However, it opened Wednesday below that level, keeping sellers hopeful.
The 14-day Relative Strength Index (RSI) is trading well below the 50 level, suggesting that there is more pain in store for Gold buyers.
Meanwhile, the 21-day and 50-day SMAs Bear Cross, confirmed last week, also remains in play.
Therefore, any corrective upside in Gold price could be seen as a good selling opportunity for Gold sellers in the near term.
Key support levels are now seen at the December 13 low of $1,973 and the horizontal 200-day SMA at $1,966. A sustained move below the latter will put the $1,950 psychological level at risk.
On the contrary, if Gold price manages to recapture the 100-day SMA support-turned-resistance at $1,993 on a daily closing basis, a fresh recovery toward the 21-day SMA of $2,024 cannot be ruled out.
Gold price needs to find a strong foothold above the $2,000 barrier once again, at first.
 previous

