
- AUD/USD reversed its march north on Wednesday.
- The next target emerges at the 200-day SMA near 0.6560.
- The Australian Wage Price Index surprised to the upside.
The Australian dollar halted its upward trajectory, coming under selling pressure after retesting the 0.6570 zone against the US Dollar (USD) on Wednesday.
Wednesday’s bearish price action came after five consecutive daily upticks in AUD/USD following yearly lows observed in the 0.6440 range earlier in the month. The pair’s decline was underpinned by a tepid bounce in the Greenback, leading the USD Index (DXY) to remain close to the 104.00 neighbourhood.
The daily knee-jerk in spot coincided with a directionless performance for the US Dollar, as investors continued to assess the likelihood of the Federal Reserve (Fed) initiating a cycle of monetary easing later than anticipated. This sentiment gained momentum following resilient US inflation data tracked by the CPI and PPI for the month of January.
On the domestic docket, Australia’s Wage Price Index rose more than estimated by 4.2% YoY in Q4, further propping up the decision by the Reserve Bank of Australia (RBA) to not rule out further tightening in the next few months.
Still around the RBA, the central bank published its Minutes of the February meeting (“hawkish hold”) on Tuesday. The minutes revealed that the bank deliberated on whether to increase the cash rate by 25 bps or maintain it at the current level. Ultimately, the decision was made to keep the cash rate steady at 4.35% due to a perceived decrease in the risk of inflation not meeting the Board’s target within an acceptable timeframe. Additionally, members reached a consensus on the importance of neither definitively endorsing nor dismissing the possibility of future interest rate hikes.
Despite the ongoing recovery of AUD/USD, investors are expected to closely follow developments in China, commodity prices (mainly copper and iron ore), and movements in the US Dollar.
While extra stimulus measures in China could potentially reinforce a near-term rebound, news of a more sustainable recovery in the country is needed to lend stronger legs to the Australian currency and, therefore, spark a more convincing move higher in AUD/USD. Along with a bounce in the Chinese economy, it is also expected to tag along an improvement in commodity prices, which should also morph into further support for the AUD. Furthermore, the current restrictive stance of the RBA should also keep the Aussie dollar well supported in bearish attempts.
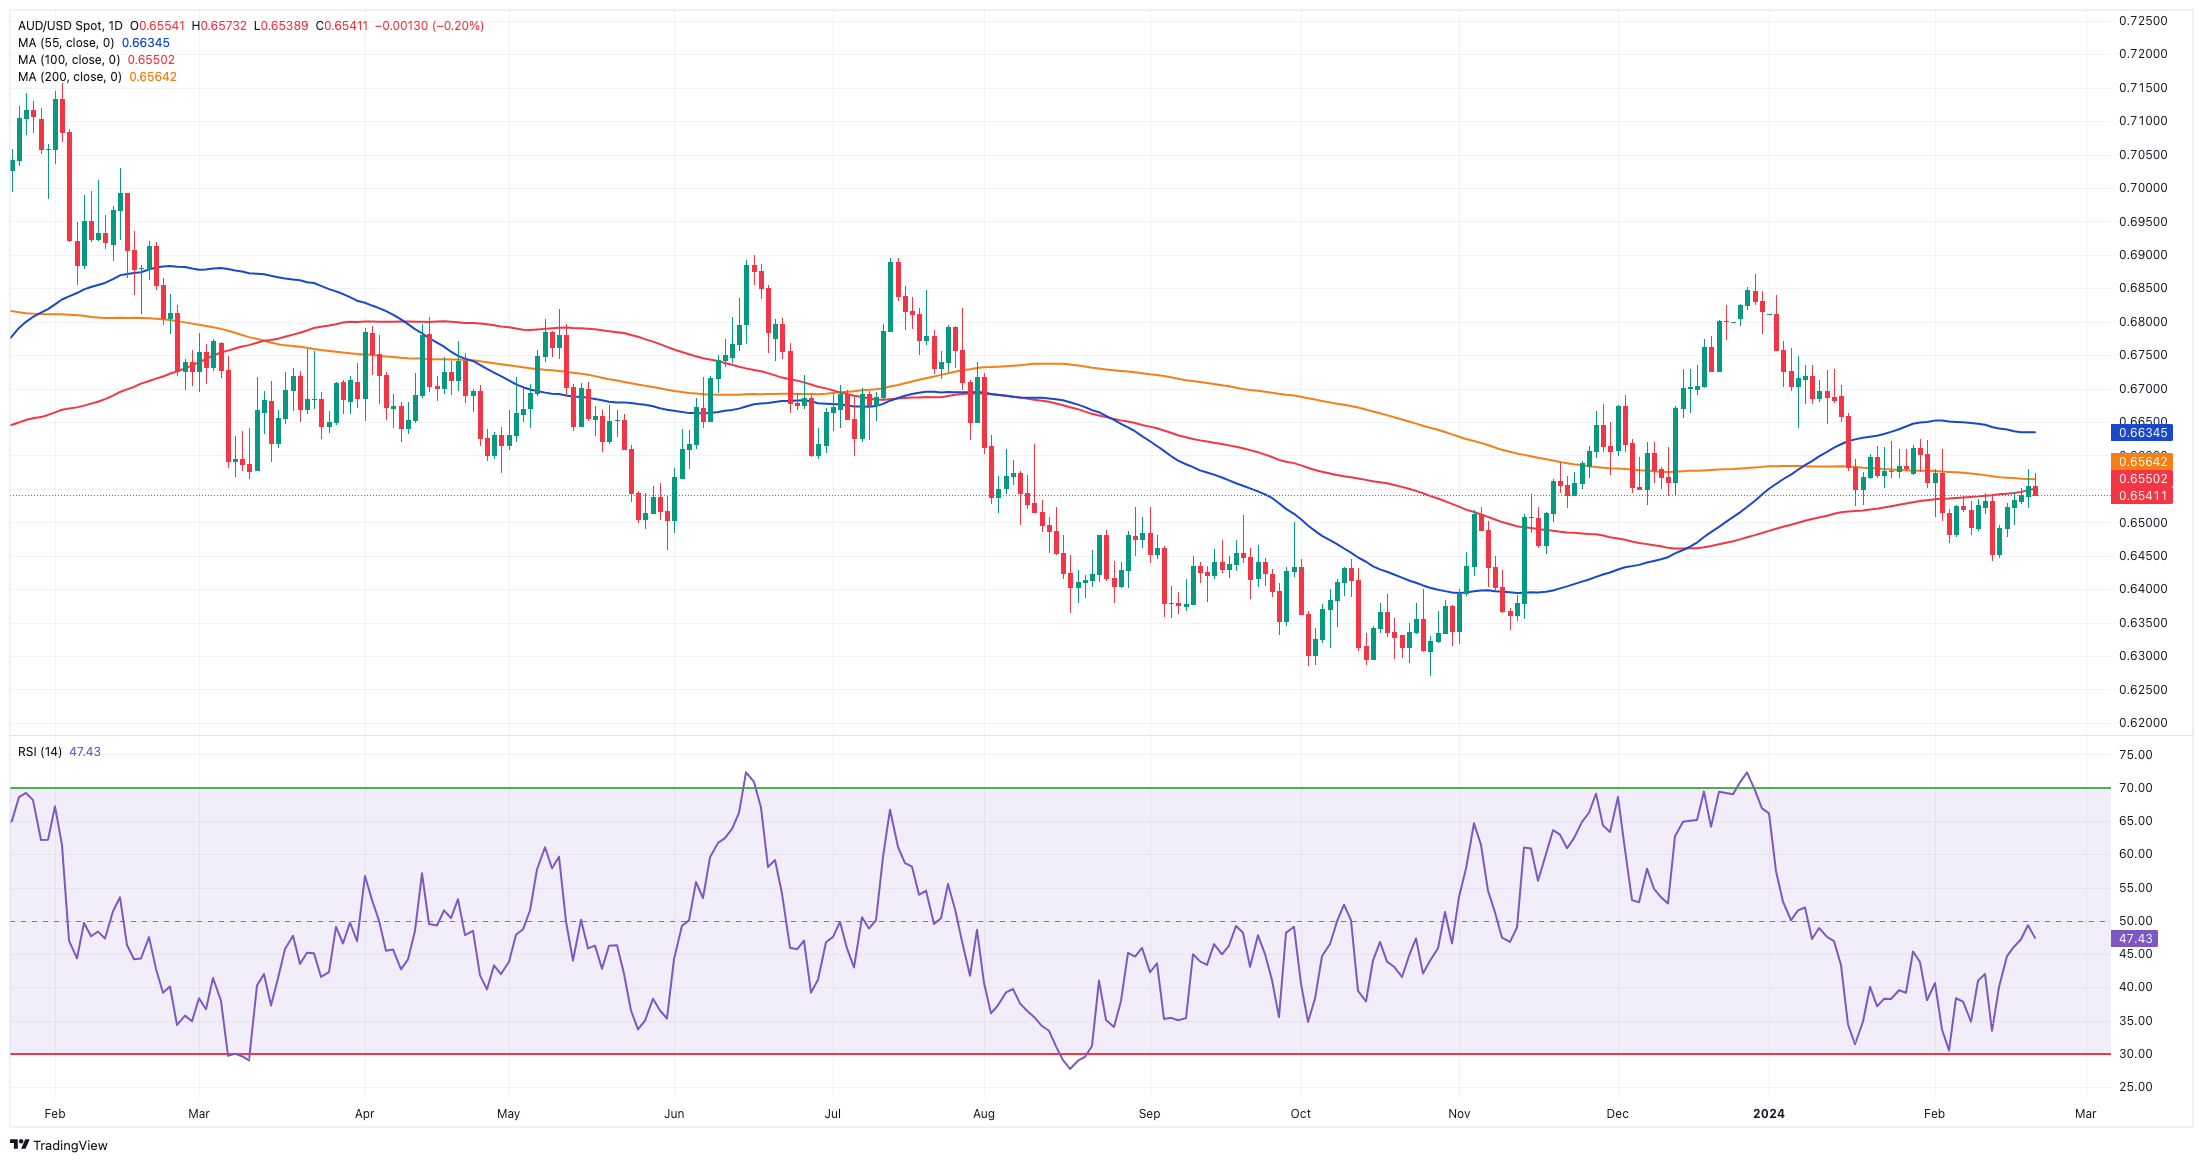
AUD/USD daily chart
AUD/USD short-term technical outlook
Further upside should prompt AUD/USD to revisit the temporary 55-day SMA at 0.6629, an area coincident with the late January highs (January 30). A break above this range may take the pair towards the December 2023 top of 0.6871 (December 28), seconded by the July 2023 peak of 0.6894 (July 14) and the June 2023 high of 0.6899 (June 16), all before the key 0.7000 milestone.
On the other hand, bearish attempts may drive AUD/USD to initially test its 2024 low around 0.6452 (February 13). Breaking below this level may lead to a retest of the 2023 low of 0.6270 (October 26), followed by the round level of 0.6200 and the 2022 low of 0.6169. (October 13).
It is worth mentioning that for the AUD/USD to see more short-term gains, it must clearly surpass the crucial 200-day SMA, today at 0.6562.
The 4-hour chart indicates hints that the recovery will continue in the short future. Against that, first resistance is at 0.6579 prior to 0.6610. Surpassing this zone indicates a probable advance towards 0.6728. Meanwhile, a break of 0.6442 may cause a decrease to 0.6347, then 0.6338. The MACD advanced to the positive zone, and the RSI appears stable near 57.
 previous

