
AUD/USD Current Price: 0.6745
- The poor performance of global equities limited the bullish potential of AUD/USD.
- Raising government bond yields reflects renewed inflation-related concerns.
- AUD/USD is at risk of losing the 0.6700 level in the upcoming sessions.
The AUD/USD pair posted gains for a third consecutive day, hitting on Wednesday an intraday high of 0.6800 but settling in the 0.6740 price zone. The pair advanced throughout the first half of the day despite the poor performance of Asian and European equities, retreating during US trading hours as Wall Street followed the lead of their overseas counterparts.
The focus stayed on government bond yields and renewed concerns about potentially higher inflation. The Australian 10-year bond yield increased by more than 20 bps, while the US one held around the multi-week high posted on Tuesday.
AUDUSD short-term technical outlook
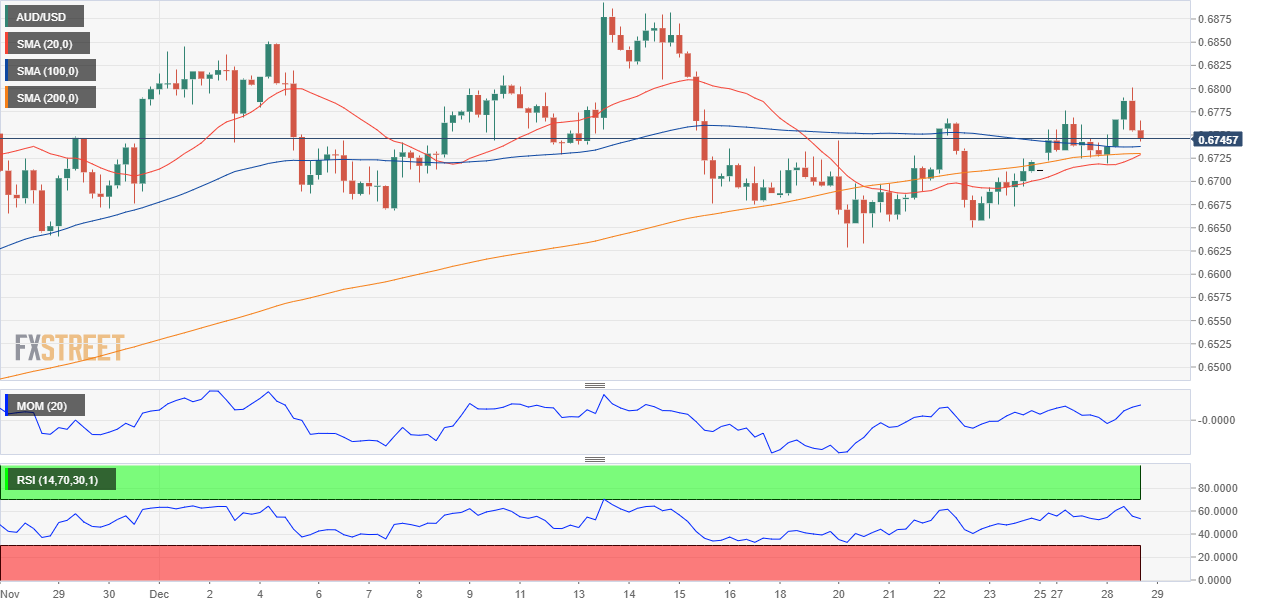
The daily chart for AUD/USD pair shows that it trades around a flat 20 SMA despite being unable to clear the dynamic resistance area. The 200 SMA heads firmly lower, far above the current level, while the 100 SMA stands directionless at around 0.6650, providing support. Technical indicators, in the meantime, have turned flat around their midlines, reflecting the absence of directional strength.
In the near term and according to the 4-hour chart, the pair keeps developing above all of its moving averages, although the 100 SMA heads south while converging 20 and 200 SMAs advance below it. Technical indicators have retreated from near overbought readings, heading south but holding within positive levels, falling short of anticipating a steeper decline.
Support levels: 0.6715 0.6670 0.6630 0.
Resistance levels: 0.6775 0.6810 0.6850
View Live Chart for the AUD/USD
 previous

