
US Dollar: Sep '22 USD is Down at 108.280.
Energies: Sept '22 Crude is Up at 93.47.
Financials: The Sep '22 30 Year bond is Down 27 ticks and trading at 136.31.
Indices: The Sep '22 S&P 500 Emini ES contract is 53 ticks Lower and trading at 4187.75.
Gold: The Dec'22 Gold contract is trading Down at 1762.60. Gold is 88 ticks Lower than its close.
Initial conclusion
This is not a correlated market. The dollar is Down, and Crude is Up which is normal, and the 30-year Bond is trading Lower. The Financials should always correlate with the US dollar such that if the dollar is lower, then the bonds should follow and vice-versa. The S&P is Lower, and Crude is trading Higher which is correlated. Gold is trading Lower which is not correlated with the US dollar trading Down. I tend to believe that Gold has an inverse relationship with the US Dollar as when the US Dollar is down, Gold tends to rise in value and vice-versa. Think of it as a seesaw, when one is up the other should be down. I point this out to you to make you aware that when we don't have a correlated market, it means something is wrong. As traders you need to be aware of this and proceed with your eyes wide open. All of Asia is trading Higher except the Shanghai exchange. Currently all of Europe is trading Lower except the London exchange which is Higher.
Possible challenges to traders today
-
Core PCE Price Index is out at 8:30 AM EST. This is Major.
-
Goods Trade Balance is out at 8:30 AM EST. Major.
-
Personal Income is out at 8:30 AM EST. This is Major.
-
Personal Spending is out at 8:30 AM EST. This is Major.
-
Prelim Wholesale Inventories is out at 8:30 AM EST. Major.
-
Fed Chair Powell Speaks at Jackson Hole Symposium. Major
-
Revised UoM Consumer Sentiment is out at 10 AM. Not Major.
-
Revised UoM Inflation Expectations is out at 10 AM. Not Major.
Treasuries
Traders, please note that we've changed the Bond instrument from the 30 year (ZB) to the 10 year (ZN). They work exactly the same.
We've elected to switch gears a bit and show correlation between the 10-year bond (ZN) and the S&P futures contract. The S&P contract is the Standard and Poor's, and the purpose is to show reverse correlation between the two instruments. Remember it's likened to a seesaw, when up goes up the other should go down and vice versa.
Yesterday the ZN made its move at around 7:45 AM EST. The ZN hit a High at around that time and the S&P moved Higher shortly thereafter. If you look at the charts below ZN gave a signal at around 7:45 AM EST and the S&P moved Higher at around the same time. Look at the charts below and you'll see a pattern for both assets. ZN hit a High at around 7:45 AM EST and the S&P was moving Higher shortly thereafter. These charts represent the newest version of MultiCharts and I've changed the timeframe to a 15-minute chart to display better. This represented a Shorting opportunity on the 10-year note, as a trader you could have netted about 18 ticks per contract on this trade. Each tick is worth $15.625. Please note: the front month for the ZN is now Sep '22. The S&P contract is also Sep' 22 as well. The front months are now Sep' 22. I've changed the format to Renko Bars such that it may be more apparent and visible.
Charts courtesy of MultiCharts built on an AMP platform
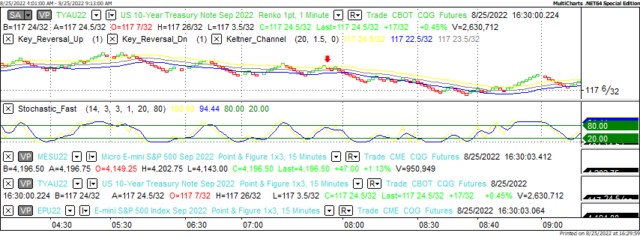
ZN – Sep 2022 – 08/25/22
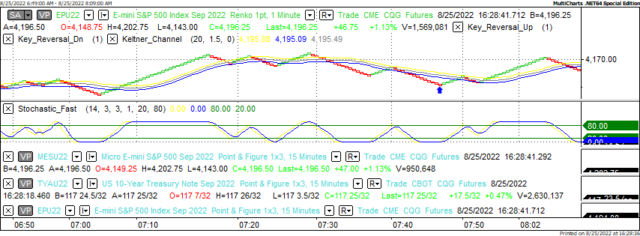
S&P – Sep 2022 – 08/25/22
Bias
Yesterday we gave the markets an Upside bias as we didn't feel the markets went High enough to satisfy the Smart Money. That and the USD was trading Lower as the indices were climbing Higher. The markets didn't disappoint as the Dow climbed Higher by 322 points and the other indices traded Higher as well. Today we aren't dealing with a correlated market and our bias is Neutral.
Could this change? Of Course. Remember anything can happen in a volatile market.
Commentary
Yesterday when we first viewed the markets the USD was trading Lower, and the indices were pointed Higher. This unto itself is normal for market correlation purpose, but we usually seek for more proof. What led us to give the Upside bias was the fact that after a number of days closing Lower and the indices losing hundreds of points; we didn't think the Smart Money would be satisfied with the gains from Wednesday's session. This is a call that can be made by years of experience watching the markets. Does it work all the time? No. In this case it did but we are not infallible. Today we have the Fed Chair speaking from the annual Jackson Hole Symposium, and you can bet that all eyes and ears will on what Fed Chair says or perhaps what he doesn't say. Will his comments be dovish or hawkish? As in all things, only time will tell…
 previous

