
It was quite a day across the financial markets on Thursday as the eagerly awaited US inflation data hit the wires at 1:30 pm GMT.
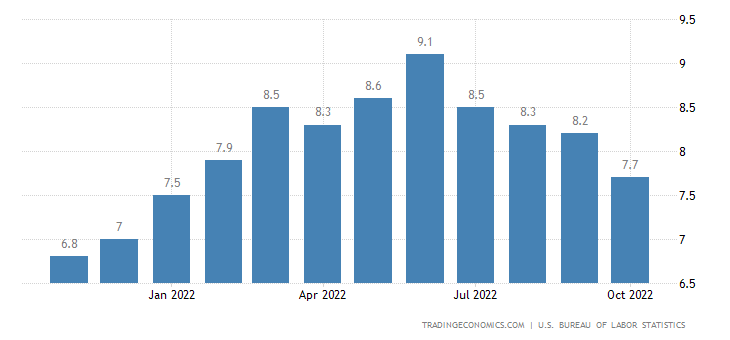
Consumer prices, measured by the Consumer Prices Index (CPI), increased less than anticipated. According to the Bureau of Labour Statistics (BLS), consumer prices increased 7.7% on a year-over-year basis, following September’s 8.2% reading, representing the fourth decline since topping at 9.1% in June (its largest increase since the early 1980s). Interestingly, this is the first time since February this year that the headline year-on-year inflation print has been south of the 8.0% mark.
Core annual inflation for October—excluding volatile food and energy prices—rose 6.3%, from 6.6% recorded in September. In terms of the month-over-month data, the CPI rose 0.4% in October, identical to September’s reading. Core monthly inflation, however, rose 0.3%, following September’s rise of 0.6%.
The BLS highlighted the following:
The energy index increased 17.6% for the 12 months ending October, and the food index increased 10.9 percent over the last year; all of these increases were smaller than for the period ending September.
This suggests that the US Federal Reserve may ease rate hikes, after the central bank delivered a fourth consecutive super-sized 75 basis-point hike on 2nd November. Fed Funds Futures, according to the CME’s FedWatch Tool, shows that the target rate probability for a 50 basis-point hike at the mid-December Fed meeting has risen to 80.6%, with a 19.4% chance of a 75 basis-point increase. This expectation was clearly felt in the markets on Thursday.
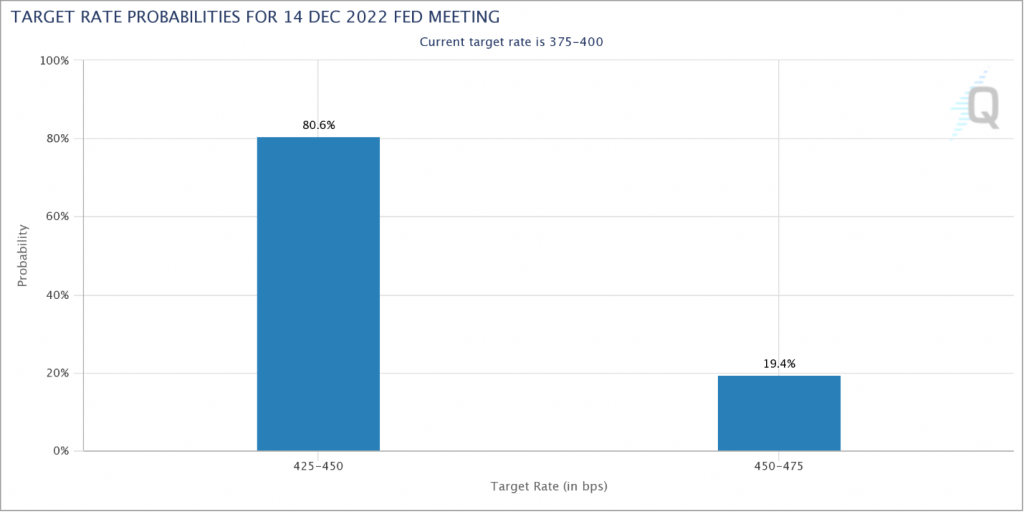
(CME FedWatch Tool)
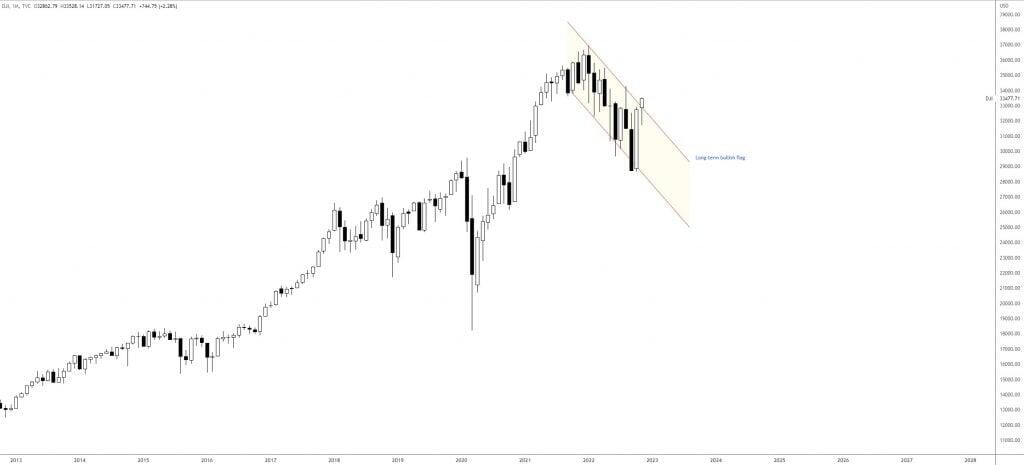
US Equities: Long Term-Bullish Flag Eyed
Major US equity indices powered higher in recent movement, seeing the Nasdaq 100 jump 6.0% at one point; the S&P 500 was also not far behind at 4.6% with the Dow higher by 3.0%. Of technical relevance is the Dow (see chart below) on the monthly scale, exhibiting interest above the upper limit of a bullish flag pattern, taken from the high of 36,952 and a low of 32,272. Note that this market has been entrenched within a dominant uptrend since early 2009.
Strength in procyclical currencies on Thursday should not surprise. Against the broadly softer dollar (Dollar Index down nearly 2.0%), the Australian dollar, the New Zealand dollar and the Canadian dollar all staged strong outperformance, up 2.5%, 2.1% and 1.2%, respectively.
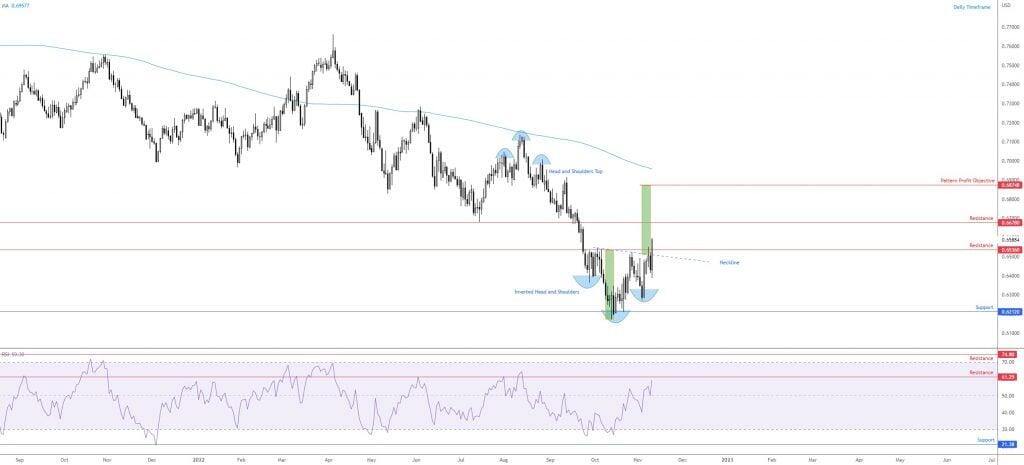
AUD/USD: Head and Shoulders, Anyone?
The AUD/USD (see daily chart below) has been a market I have been watching for a while. Through the lens of a technician, attention has been drawn to the daily timeframe’s potential inverted head and shoulders pattern ($0.6363; $0.6170; $0.6272). Although the currency pair has emphasised a clear-cut downtrend since early 2021, price recoiled from daily support at $0.6212 and just north of weekly demand at $0.5975-0.6166 (see weekly chart). The strength behind Thursday’s upside unleashed a decisive close above not only daily resistance at $0.6536, but also beyond the inverted head and shoulders pattern neckline, pencilled in from the high $0.6547.
With the aforementioned resistance cleared, daily resistance calls for attention at $0.6678, followed by the pattern’s profit objective set at $0.6875. Adding to the current bullish vibe, the relative strength index (RSI) retested the upper edge of the 50.00 centreline and touched the 60.00ish neighbourhood, with indicator resistance visible at 61.29.
Consequently, heading into Friday’s sessions, traders may pursue bullish scenarios above $0.6536 on the lower timeframes.
 previous

